Cross-State Comparisons of Cannabis Sales
LeafLink published a State of the Industry report, which contained some useful state-by-state comparisons.
I was particularly interested in the cross-state comparisons of
Retail Sales per Dispensary (“12-Month Retail Sales” per retail license)
Retail Sales per Resident
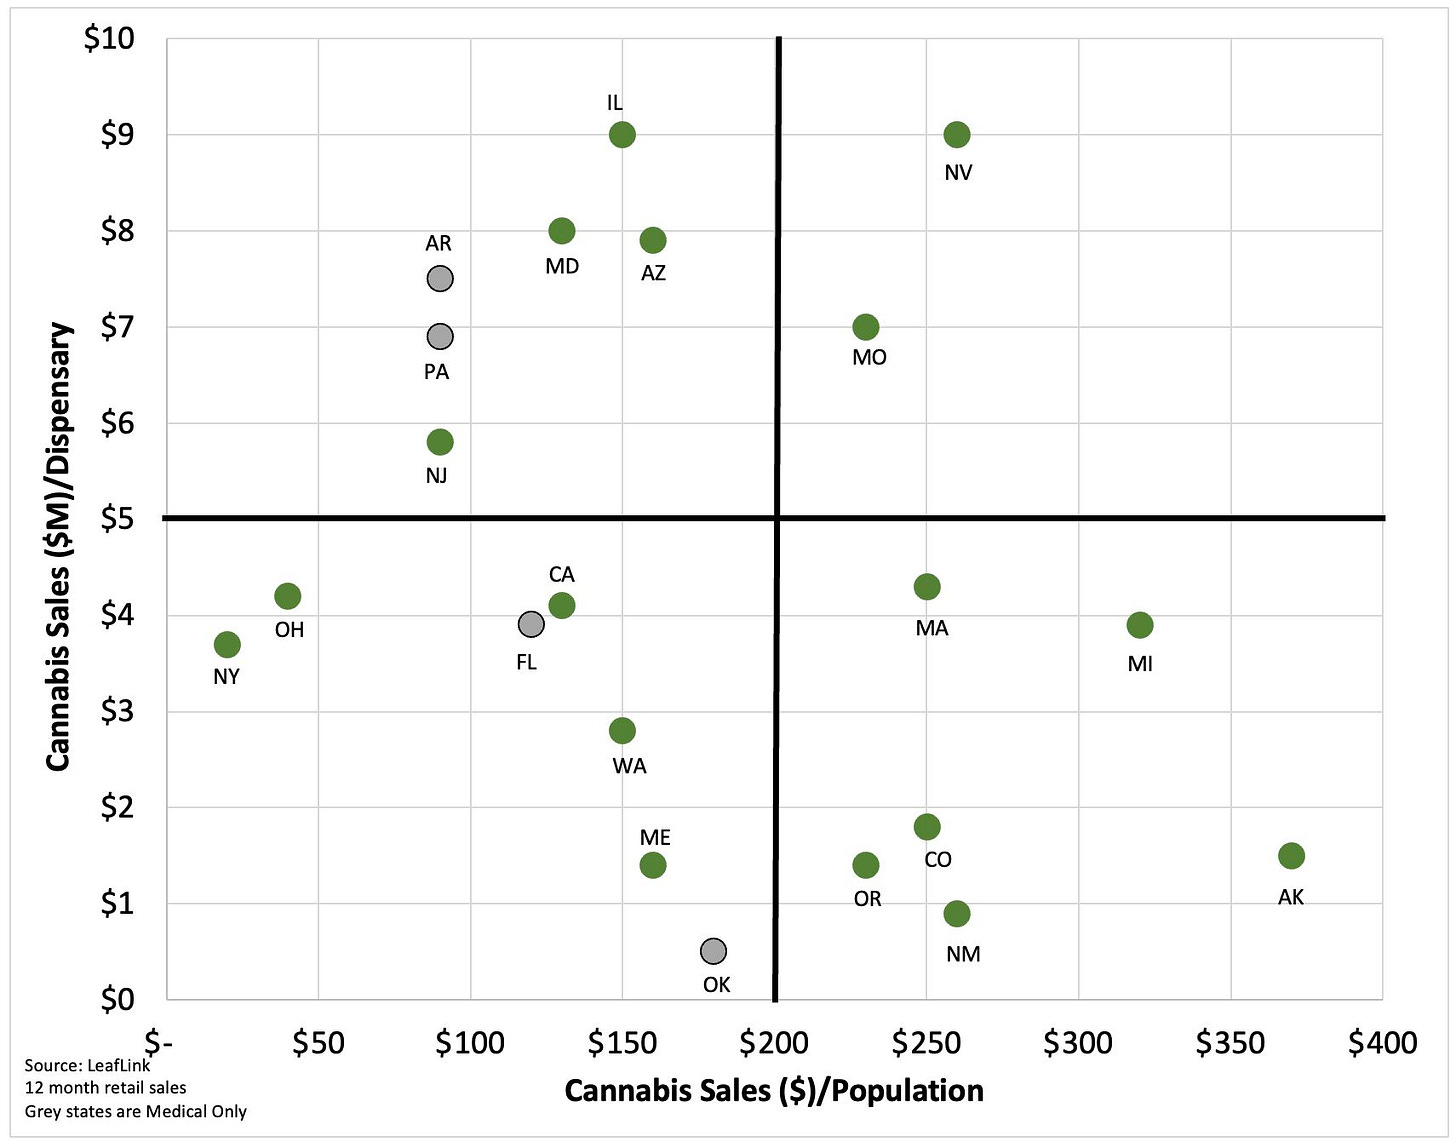
I read the approximate numbers provided off these two graphs and plotted them against one another to see what I could see.
It’s difficult to make generalizations about cannabis markets, because each state has a relatively unique environment.
Sales per Dispensary is more straightforward than Sales per Population.
Generally speaking, a state will have higher sales per dispensary if retail licenses are limited in availability. Otherwise, large sales per dispensary should attract new entrants into the market (assuming sales and profits move together).
Leaflink’s data suggest the states located in the top horizontal half of the graph have higher than average sales per dispensary: NV, MO, IL, MD, AZ, AR, PA, and NJ
Sure enough, a previous analysis I conducted confirms that these states generally have lower than average licenses per population.
AR and PA are notable for having relatively high sales per dispensary despite being Medical Only states.
Sales per Population is less clear-cut.
A state may have higher than average sales per capita (right vertical half of the diagram) if any of the following hold:
The market is more mature, i.e., adult use has been legal for a good number of years (MA, MI, AK, CO, OR)
State residents have a culture more inclined toward cannabis use (MA, MI, AK, CO, OR)
The state attracts out-of-state consumers, either because it’s a high tourism state (NV) or because it borders nonlegal states (MI, IL)
A state may have lower than average sales (left vertical half of the diagram) if any of the following hold:
The state is Medical Only (FL, OK)
The state recently legalized adult use (NY, OH)
Licensed markets unduly compete with unlicensed markets, generally due to high taxes (CA, WA)


